An error in how the unemployment rate was calculated means we should be more worried than we already are
Faculty | Jul 16, 2020 | Gabelli School of Business
The U.S. headline unemployment rate dropped from 13.3% in May to 11.1% in June. This is very good news. Coming on the heels of the previous month’s drop from 14.7%, the highest unemployment rate since World War II, it suggests that the U.S. labor market, badly damaged by the coronavirus pandemic, appears to be on course for a quick recovery.
As good as the news seems to be, the improvement in the unemployment rate was even better than the headline numbers suggest. Yet more ominously, the improvement seems better because last month’s starting point for comparison was a lot higher than 13.3%.
The U.S. Bureau of Labor Statistics (BLS) reported in a footnote to its July 2 press release that the headline unemployment rate likely understates the true unemployment rate, due to a misclassification error that counted some temporarily unemployed workers as employed in its monthly household survey data. The BLS included a similar footnote in its April 3, May 8, and June 5 press releases concerning the employment situation in March, April, and May, respectively.
Here is the explanation for the error. The BLS conducts a household survey in the middle of each month and uses the results to calculate the monthly unemployment rate, which it reports shortly after month-end. The BLS explained in a footnote that it had instructed its interviewers to classify people who were absent from work due to temporary, coronavirus-related business closures as “unemployed on temporary layoff.” Accordingly, a survey respondent who reported she was not working during that week but said she expected to be summoned back to her job should have been recorded as “unemployed on temporary layoff.” This would be consistent with the usual practice of counting as unemployed people who have been laid off but expect to be recalled (regardless of whether they are looking for other work).
But, as often is the case, there is a complication. The correct classification of someone who is temporarily absent from her job depends on the reason for her absence. She would be counted as employed if she were temporarily absent because of bad weather, illness, a labor-management dispute, personal reasons, or vacation. These reasons seem clear enough.
Here is the complication. She can also be recorded as employed but absent from work for some “other reason.” For example, she might have taken a leave of absence to care for a loved one who was ill with COVID-19. When an “other reason” is cited, the interviewer usually records a brief description. When the BLS reviewed these descriptions, it found that a significant number of respondents had been misclassified in its four surveys for March through June as employed but absent from work, instead of unemployed on temporary layoff.
Correcting the misclassification error would have increased the headline unemployment rate by almost one full percentage point in March, almost five percentage points in April, about three percentage points in May, and about one percentage point in June, all on a not seasonally adjusted basis. Importantly, the misclassification errors are smaller in more recent months, which gives reason to hope they will soon stop affecting the unemployment rate.
Nevertheless, the errors affect the last four monthly unemployment rates to differing degrees. And the misclassification errors are large enough that they affect our interpretation of the data, as I will explain. The headline unemployment rate fell 1.4% in May (from 14.7% to 13.3%) and a further 2.2% in June (to 11.1%). This suggests an acceleration in the labor market’s recovery.
Here is even better news. As the accompanying chart illustrates, correcting the misclassification error reveals much larger-than-headline-rate decreases in May, a decrease of 3.4% versus only a 1.4% drop based on the headline unemployment rates, and in June, a decrease of 4.2% versus only a 2.2% drop implied by the headline unemployment rates.
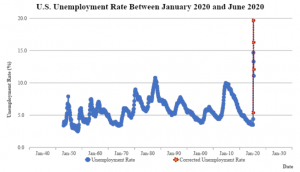
Unfortunately, there is no free lunch here. The chart also reveals that correcting the errors indicates bigger-than-headline-rate increases in the unemployment rate for March, a 1.9% increase up from 0.9%, and for April, a 14.3% increase up from 10.3%. The corrected unemployment rates are higher for all four months. And the rate peaked at 19.7% in April, which is five percentage points above the headline rate. It is also far higher than the peak unemployment rate during the Great Recession of 10.0% in October 2009. Where do all the adjustments leave us? The corrections still leave the U.S. with a June unemployment rate of 12.1%, one percentage point above the headline number.
The chart also illustrates an important characteristic of the COVID-19 world. Volatility, in this case month-to-month changes in the unemployment rate, has increased and by even more than the headline numbers suggest. It is considerably more volatile than at any time during the post-World War II period. The one-month decreases of 4.2% in June and 3.4% in May (both on a corrected basis) are the biggest going back to 1948. The next largest one-month drop was 1.5% in November 1949. The two-month decrease of 7.5% (on a corrected basis and compounded) between April and June is the biggest going back to 1948. The next largest two-month drop was 1.3% between October and December 1949.
The greater unemployment rate volatility is concerning. It means there is a greater risk of a sharp reversal in the unemployment rate if a resurgence in the coronavirus leads more states to reimpose restrictions, such as closing bars, gyms, and restaurants. There is a risk of greater damage to the labor market and the economy than the last four months’ headline unemployment rates suggest. The BLS reported that total nonfarm payroll employment rose by 7.5 million in May and June combined as states reopened their economies. These jobs are potentially at risk if states retrench. And the U.S. unemployment rate could conceivably ratchet up above the April peak of 14.7%, especially if the number of unemployed are counted correctly in coming months. Since the June household survey was conducted between June 7 and June 13 and many states hit the pause button in the second half of June, unemployment may have already begun ticking up.
Those who refuse to wear masks or practice safe social distancing are not only placing many of their fellow citizens at risk of contracting COVID-19, but they are also increasing the likelihood that state and local governments will feel compelled to reimpose tighter restrictions that could force thousands of employers to cut back their operations or shut down their businesses a second time—causing millions of recently rehired workers to once again suffer the loss of their jobs.
John D. Finnerty is a professor of finance at Fordham University.


